
Data, analytics & dashboards
We help you make the numbers usable. We structure data and build clear reports and dashboards so you can quickly see the situation — sales, customers or inventory — and make better decisions.
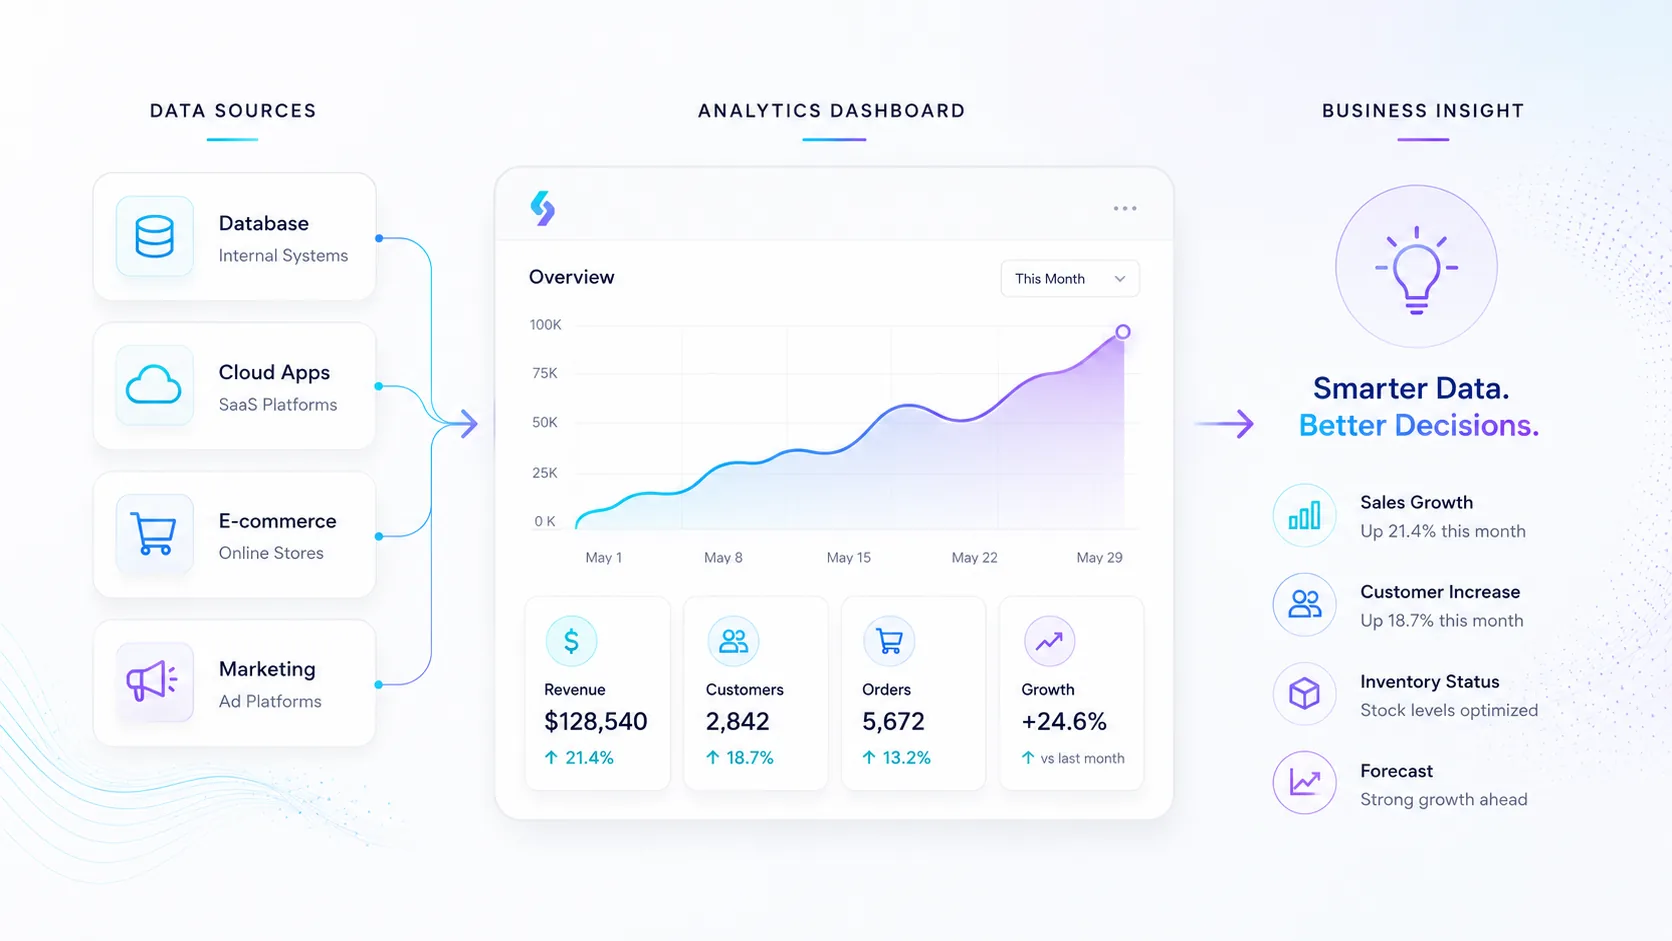
What we help you with
We help you make the numbers usable. We structure data and build clear reports and dashboards so you can quickly see the situation — sales, customers or inventory — and make better decisions.
When this service fits
A good fit if you have data in several systems and want to see the situation quickly — sales, customers or inventory — in clear reports.
What can be included
- Database design and data collection (ETL)
- Dashboards in Power BI and Looker Studio
- Sales, customer and inventory analysis
- Forecasts and decision support
Packages & starting prices
Starting prices give a clear baseline for different types of work. Smaller jobs can often start quickly, while larger projects begin with a short review or pre-study. After the review you get a clear proposal with scope, price and next step.
| Package | Best for | Starting Price |
|---|---|---|
| Data / reporting review | Review of data, KPIs and opportunities | from $290 |
| Simple dashboard | Power BI or Looker Studio dashboard for KPIs and reporting | from $490 |
| Customer or Sales Analysis | Segments, pipeline, margins and priorities | from $590 |
| Ongoing reporting | Recurring reports and follow-up | from $99/month |
| Data Collection / ETL | Collect, clean and combine data from files, APIs and systems | Custom quote |
| Database Design | Structure for customers, products, projects or transactions | Custom quote |
| Multiple sources / automated data flows | Unified data platform with automated flows | Custom quote |
All prices are starting prices in USD. Hosting, domains, licenses, third-party tools, advertising budget, AI usage and external platform fees are not included unless stated in the proposal. Final pricing depends on scope, integrations, content and support level.
Frequently asked questions
This is about collecting, structuring and visualizing data so you can better understand what is happening in the business. Instead of searching through several systems, files or spreadsheets, you get clear reports and dashboards that show important numbers in an accessible way.
The goal is to make data useful for decisions, follow-up and prioritization.
This service is suitable for companies that have data in several systems and want a better overview. This may include sales, customers, inventory, projects, campaigns, finance or other key metrics that matter to the business.
It is especially useful when reporting is currently done manually or when numbers need to be collected from several different sources.
A dashboard is a visual report where important metrics are shown in one place. It can show sales, number of leads, customer segments, inventory status, margins, campaign results or development over time.
The purpose is to quickly understand the situation without having to compile everything manually.
A dashboard can show almost any data, as long as the information is available and can be collected in a structured way. Common examples include sales, pipeline, customer data, margins, campaigns, inventory, orders, project status and recurring KPIs.
Which numbers should be shown depends on the decisions you need to make.
Dashboard Basic can include the setup of a clear report in Power BI or Looker Studio for KPIs, follow-up and recurring reporting. It can be built from spreadsheets, exports, databases or other data sources.
The goal is to create a practical first dashboard that gives faster insight into the business.
Power BI is often suitable for more advanced analysis, internal reports, Microsoft environments and larger datasets. Looker Studio is often suitable for simpler dashboards, marketing reporting and connections to Google-related data sources.
The right choice depends on the systems you use, the type of reporting you need and how advanced the analysis should be.
Customer or sales analysis means reviewing data to find patterns, segments and improvement opportunities. It can show which customers are most profitable, which campaigns perform best, what the sales pipeline looks like or where sales slow down.
The analysis helps you prioritize the right customers, offers and actions.
Sales analysis can include pipeline, revenue, margins, conversion rate, campaign results, sales activities, customer segments, repeat customers and bottlenecks in the sales process.
The goal is to understand what drives results and where there is room for improvement.
Customer data can be used to identify segments, buying behavior, repeat customers, customer value, churn risk, geographic patterns or which services and products are most common.
This makes it easier to prioritize marketing, sales, follow-up and customer care.
Inventory analysis is about getting better control over stock levels, products, sales pace, backorders, waste, turnover rate and purchasing needs.
It can help companies avoid both overstocking and running out of important products.
ETL stands for Extract, Transform, Load. It means that data is collected from one or more sources, cleaned or structured and then loaded into a database, report or dashboard.
ETL is used when data needs to be combined from several systems or when raw data is not ready to use directly.
Data collection or ETL can include collecting data from files, APIs, databases or systems, cleaning the data, combining several sources and making it usable for reporting.
This is often an important step before a dashboard can become reliable.
Data often needs cleaning because it may contain duplicates, incorrect formats, missing values, different naming conventions or information spread across several places.
If the data is not cleaned, reports can show incorrect numbers or lead to misleading conclusions.
Database design means creating a clear structure for how information should be stored and connected. This may include customers, products, projects, transactions, orders, tickets or other parts of the business.
A good database structure makes it easier to build reports, integrations and systems that can be developed further.
Spreadsheets often work well at the beginning, but can become difficult to manage when the data grows, several people work at the same time or information needs to connect to systems and reports.
A database is better when information needs to be more structured, secure, scalable and reliable.
Yes. We can help combine data from CRM, webshops, accounting systems, spreadsheets, inventory systems, advertising platforms or other tools.
First, we need to check how the data can be collected, what format it has and how it should be connected.
Yes, in many cases dashboards can update automatically. This depends on the data sources, integration options and how often the information needs to refresh.
Automatic updates reduce manual work and make reporting more current.
Yes. Reports can often be created and sent automatically to the right people on a schedule. This may include monthly reports, sales reports, inventory overviews, campaign reports or management reports.
This makes recurring reporting more consistent and less dependent on manual work.
Monthly Analysis includes recurring analysis, reporting and improvement suggestions. This can involve reviewing trends, deviations, development and key metrics, then suggesting what should be prioritized next.
The service is suitable for companies that want ongoing support in interpreting numbers and improving decisions.
A dashboard shows numbers and development visually. Analysis goes one step further and interprets what the numbers mean, why something is changing and what actions may be reasonable.
A dashboard shows the current situation. Analysis helps you understand what to do with the information.
Yes. We can help choose KPIs that are relevant to the business. Examples include sales, margin, conversion rate, number of leads, customer value, inventory turnover or recurring revenue.
The right metrics should support decisions, not just look good in a report.
Forecasts and decision support use historical data and current trends to estimate future development. This may involve sales, demand, inventory needs or campaign performance.
Forecasts are not guarantees, but they can provide better support for planning and prioritization.
Yes. Dashboards can be adapted to different audiences. Management may need an overview of KPIs and development, while sales, inventory or marketing teams may need more detailed reports for daily work.
It is often best to build reports based on who will use them and which decisions they should support.
First, data sources, definitions and calculations need to be reviewed. If different systems calculate in different ways, the same metric can show different results.
We help clarify where the data comes from, how it is calculated and what needs to be adjusted to make reporting more reliable.
No. It is common for data to be incomplete or spread across different places at the beginning. Often, part of the work is understanding the current situation, cleaning information and creating a better structure step by step.
The most important thing is to start with clear questions: what do you want to see, follow up and make decisions about?
It depends on the data sources, scope and how much the data needs to be processed. A simpler dashboard can move faster if the data is already structured, while several systems, APIs, cleaning and custom calculations require more work.
After a short review, we can provide a clearer proposal for scope and timeline.
We need to know which systems you use, what data exists, which reports you use today and which decisions you want to make faster. Examples of current spreadsheets, reports or exports are often very useful.
We also need to understand which users should see the reports and how often they need to be updated.
Yes, where relevant. Licenses for analytics tools, databases, APIs, cloud services or external system costs are normally added separately from our work.
We aim to clarify these costs early so the budget is realistic.
Yes. It is often wise to start with a first version showing the most important metrics and then expand with more data sources, reports, filters and more advanced analysis.
This makes the project easier to start and reduces the risk of building too much before the needs are clear.
Want to know what it would cost for you?
Book a free meeting and we'll do a short needs review and come back with a clear proposal.